Today, the Covered Calls Advisor sold out of all remaining long positions after the June options expiration and the portfolio is now 100% cash. The Overall Market Meter remains at Neutral, and covered calls investing often outperforms the overall market in these situations. However, this advisor has not recently had adequate time to devote to staying abreast of financial news and performing my normal and extensive due diligence on potential stock investments. In these circumstances, it is better to pause (rather than compromise my analysis standards) until I can return to my normal avid reading of finance and investing news. This period (of about two weeks) is like a summer vacation away from investing. I will then be able to resume my normal research efforts and will relatively soon thereafter return to active management of the Covered Calls Advisor Portfolio on this blog site.
So until then:
Regards and Godspeed,
Jeff
Tuesday, June 25, 2013
Saturday, June 22, 2013
June 2013 Expiration Results
The Covered Calls Advisor Portfolio (CCAP) contained eleven positions with June 2013 expirations. A summary of the results is as follows:
- Nine positions (Apple Inc., Barrick Gold Corp., Fluor Corporation, Fusion-io Inc., Hertz Global Holdings Inc., iShares MSCI China ETF, Potash Corp of Saskatchewan Inc., Tesoro Corporation, and Transocean Inc.) had their options expire yesterday since the stock prices closed below the Jun2013 options' strike prices. So now, the Covered Calls Advisor Portfolio (CCAP) is long shares in these nine equities. A decision will be made during this week to either sell these shares or to continue with these equities by establishing covered calls positions by selling Jul2013 call options. When these decisions are made and the accompanying transactions are completed, a post will be made on this blog on the same day with the transaction details.
- The other two covered calls positions (Prudential Financial Inc. and Symantec Corp.) were closed out upon Jun2013 options expiration since the stocks closed above the strike prices. Hence, the options expired and the accompanying equities were assigned at their respective strike prices.
The cash available from the closing of these positions will be retained in the Covered Calls Advisor Portfolio until new covered calls positions are established. These transactions will be posted on this blog the same day they occur.
The annualized return-on-investment financial results for these two closed positions are:
Prudential Financial Inc. = +26.6%
Symantec Corp. = +47.3%
With only two of eleven positions being closed out, this was a difficult month. This result occurred primarily as a result of the precipitous market decline on Wednesday and Thursday this week when Bernanke announced the likely future tapering (and ultimate elimination) of Fed's Treasury bond buying stimulus program.
The detailed transactions history and results for the two closed positions are provided below.
1. Prudential Financial Inc. (PRU) -- Closed
The transactions history was as follows:
05/31/2013 Sold 3 Prudential Financial Inc. (PRU) Jun2013 $67.50 Put Options @ $1.12
Note: the price of PRU was $69.02 today when these Puts were sold.
06/22/2013 PRU Jun2013 options expired
Note: the price of PRU stock was $71.55 upon Jun2012 options expiration.
The Covered Calls Advisor does not use margin, so the detailed information on this position and the results shown below reflect the fact that this position was established using 100% cash securitization for the three Put options sold.
The overall performance result(including commissions) for this PRU transaction was as follows: 100% Cash-Secured Cost Basis: $20,250.00 = $67.50*300
Net Profit:
(a) Options Income: +$324.80
= ($1.12*300 shares) - $11.20 commissions
(b) Dividend Income: +$0.00
(c) Capital Appreciation (PRU remained above $67.50 strike price at Jun2013 expiration): +$0.00
= ($67.50-$67.50)*300 shares
Total Net Profit (PRU remained above $67.50 strike price at Jun2013 options expiration): +$324.80
= (+$324.80 +$0.00 +$0.00)
Absolute Return (PRU above $67.50 at Jun2013 options expiration and Put options thus expire worthless): +1.6%
= +$324.80/$20,250.00
Annualized Return (PRU stock price above $67.50 at expiration): +26.6%
= (+$324.80/$20,250.00)*(365/22 days)
2. Symantec Corp. (SYMC) -- Closed
This position was an example of the "Early Assignment or Dividend Capture Strategy". The details of this strategy as applied to this covered calls position is described here (see "link ") on the day the position was established. As shown below, the Dividend Capture occurred in this instance. Although there was only $.07 time value remaining at market close the day prior to the ex-dividend date, and thus the time value was less than the $.15 dividend, the calls options were not exercised to capture the dividend. So, the Covered Calls Advisor retained the shares and captured the dividend.
The transactions were as follows:
06/12/2013 Bought 500 SYMC shares @ $22.19
06/12/2013 Sold 5 SYMC Jun2013 $22.00 Call Options @ $.40
06/17/2013 Ex-dividend of $.15 per share
06/22/2013 5 SYMC call options assigned and stock sold at $22.00 strike price
Note: the price of SYMC was $22.23 at the market close yesterday (options expiration Friday)
The overall performance result (including commissions) for this Symantec Corp (SYMC) covered calls position was as follows:
Stock Purchase Cost: $11,103.95
= ($22.19*500+$8.95 commission)
Net Profit:
(a) Options Income: +$187.30 = ($.40*500 shares) - $12.70 commissions
(b) Dividend Income: +$75.00
= ($.15 dividend per share x 500 shares)
(c) Capital Appreciation (Stock assigned at $22.00 at Jun2013 expiration): -$103.95
= +($22.00-$22.19)*500 - $8.95 commissions
Total Net Profit (Stock assigned at $22.00 at Jun2013 expiration): +$158.35
= (+$187.30 +$75.00 -$103.95)
Absolute Return (SYMC stock assigned at $22.00 at Jun2013 expiration): +1.4%
= +$158.35/$11,103.95
Annualized Return: +47.3%
= (+$158.35/$11,103.95)*(365/11 days);
Friday, June 14, 2013
Established Two New Gold Miners Covered Calls -- Barrick Gold Corp and Market Vectors Gold Miners ETF
Today, two new covered calls position was established in (1) Barrick Gold Corp. (Ticker Symbol ABX) and Market Vectors Gold Miners ETF (Ticker Symbol GDX), both with Jul2013 options expiration dates.
The Covered Calls Advisor believes that gold miners are very attractive investments based on their potential for earnings recoveries over the next year. Also from a technical viewpoint, they are very oversold and are likely bottoming near current prices. Moreover, with likely ongoing quantitative easing monetary policies of central banks worldwide, gold will continue to be an attractive alternative investment. Gold mining stocks are likely to move significantly higher in the months ahead. The details on the two covered calls established today are as follows:
06/14/2013 Sold 3 ABX Jul2013 $20.00 Call Options @ $.98
Note: the price of ABX was $19.70 when these options were sold.
Two possible overall performance results (including commissions) for this Barrick Gold (ABX) covered calls position is as follows:
Stock Purchase Cost: $5,918.95
= ($19.70*300+$8.95 commission)
Net Profit:
(a) Options Income: +$282.80
= 300*$.98 - $11.20 commissions
(b) Dividend Income: +$0.00
(c) Capital Appreciation (If ABX price unchanged at $19.70 at options expiration in Jul2013):
-$8.95 = ($19.70-$19.70)*300 - $8.95 commissions; or
(c) Capital Appreciation (If ABX assigned at $20.00 at Jul2013 options expiration): +$81.05
= ($20.00-$19.70)*300 - $8.95 commissions
Total Net Profit (If ABX unchanged at $19.70 at options expiration in Jul2013): +$273.85
= (+$282.80 +$0.00 -$8.95); or
Total Net Profit (If ABX assigned at $20.00): +$363.85 = (+$282.80 +$0.00 +$81.05)
Two possible overall return-on-investments are:
1. Absolute Return (if ABX price unchanged at $19.70 at Jul2013 expiration:): +4.6%
= +$273.85/$5,918.95
Annualized Return If Unchanged (ARIU): +45.6%
= (+$273.85/$5,918.95)*(365/37 days); OR
2. Absolute Return if Assigned (at $20.00): +6.1%
= +$363.85/$5,918.95
Annualized Return If Assigned (ARIA): +60.6%
= (+$363.85/$5,918.95)*(365/37 days)
2. Market Vectors Gold Miners ETF (GDX) -- New Covered Call Position
 The transactions were as follows:
6/14/2013 Bought 300 GDX shares @ $28.48
6/14/2013 Sold 3 GDX Jul2013 $29.00 Call Options @ $1.19
Note: the price of GDX was $28.51 when the options were sold.
Two possible overall performance results (including commissions) for this Market Vectors Gold Miners ETF (GDX) covered calls position is as follows:
Stock Purchase Cost: $8,552.95
= ($28.48*300+$8.95 commission)
Net Profit:
(a) Options Income: +$345.80
= 300*$1.19 - $11.20 commissions
(b) Dividend Income: +$0.00
(c) Capital Appreciation (If GDX price unchanged at $28.48 at options expiration in Jul2013):
-$8.95
= ($28.48-$28.48)*300 - $8.95 commissions; or
(c) Capital Appreciation (If GDX assigned at $29.00 at Jul2013 options expiration): +$147.05
= ($29.00-$28.48)*300 - $8.95 commissions
Total Net Profit (If GDX unchanged at $28.48 at options expiration in Jul2013): +$336.85
= (+$345.80 +$0.00 -$8.95); or
Total Net Profit (If GDX assigned at $29.00): +$492.85
= (+$345.80 +$0.00 +$147.05)
Two possible overall return-on-investments are:
1. Absolute Return (if GDX price unchanged at $28.48 at Jul2013 expiration:): +3.9%
= +$336.85/$8,552.95
Annualized Return If Unchanged (ARIU): +38.9%
= (+$336.85/$8,552.95)*(365/37 days); OR
2. Absolute Return if Assigned (at $29.00): +5.8%
= +$492.85/$8,552.95
Annualized Return If Assigned (ARIA): +56.8%
= (+$492.85/$8,552.95)*(365/37 days)
The Covered Calls Advisor believes that gold miners are very attractive investments based on their potential for earnings recoveries over the next year. Also from a technical viewpoint, they are very oversold and are likely bottoming near current prices. Moreover, with likely ongoing quantitative easing monetary policies of central banks worldwide, gold will continue to be an attractive alternative investment. Gold mining stocks are likely to move significantly higher in the months ahead. The details on the two covered calls established today are as follows:
1. Barrick Gold Corp. (ABX) -- New Covered Calls Position


This is the second covered calls position established in Barrick. They are both at the $20.00 strike price, but the prior position was for Jun2013 expiration and this one is for next month's Jul2013 options expiration.
The transactions were as follows:
06/14/2013 Bought 300 ABX shares @ $19.70 The transactions were as follows:
06/14/2013 Sold 3 ABX Jul2013 $20.00 Call Options @ $.98
Note: the price of ABX was $19.70 when these options were sold.
Two possible overall performance results (including commissions) for this Barrick Gold (ABX) covered calls position is as follows:
Stock Purchase Cost: $5,918.95
= ($19.70*300+$8.95 commission)
Net Profit:
(a) Options Income: +$282.80
= 300*$.98 - $11.20 commissions
(b) Dividend Income: +$0.00
(c) Capital Appreciation (If ABX price unchanged at $19.70 at options expiration in Jul2013):
-$8.95 = ($19.70-$19.70)*300 - $8.95 commissions; or
(c) Capital Appreciation (If ABX assigned at $20.00 at Jul2013 options expiration): +$81.05
= ($20.00-$19.70)*300 - $8.95 commissions
Total Net Profit (If ABX unchanged at $19.70 at options expiration in Jul2013): +$273.85
= (+$282.80 +$0.00 -$8.95); or
Total Net Profit (If ABX assigned at $20.00): +$363.85 = (+$282.80 +$0.00 +$81.05)
Two possible overall return-on-investments are:
1. Absolute Return (if ABX price unchanged at $19.70 at Jul2013 expiration:): +4.6%
= +$273.85/$5,918.95
Annualized Return If Unchanged (ARIU): +45.6%
= (+$273.85/$5,918.95)*(365/37 days); OR
2. Absolute Return if Assigned (at $20.00): +6.1%
= +$363.85/$5,918.95
Annualized Return If Assigned (ARIA): +60.6%
= (+$363.85/$5,918.95)*(365/37 days)
2. Market Vectors Gold Miners ETF (GDX) -- New Covered Call Position
6/14/2013 Bought 300 GDX shares @ $28.48
6/14/2013 Sold 3 GDX Jul2013 $29.00 Call Options @ $1.19
Note: the price of GDX was $28.51 when the options were sold.
Two possible overall performance results (including commissions) for this Market Vectors Gold Miners ETF (GDX) covered calls position is as follows:
Stock Purchase Cost: $8,552.95
= ($28.48*300+$8.95 commission)
Net Profit:
(a) Options Income: +$345.80
= 300*$1.19 - $11.20 commissions
(b) Dividend Income: +$0.00
(c) Capital Appreciation (If GDX price unchanged at $28.48 at options expiration in Jul2013):
-$8.95
= ($28.48-$28.48)*300 - $8.95 commissions; or
(c) Capital Appreciation (If GDX assigned at $29.00 at Jul2013 options expiration): +$147.05
= ($29.00-$28.48)*300 - $8.95 commissions
Total Net Profit (If GDX unchanged at $28.48 at options expiration in Jul2013): +$336.85
= (+$345.80 +$0.00 -$8.95); or
Total Net Profit (If GDX assigned at $29.00): +$492.85
= (+$345.80 +$0.00 +$147.05)
Two possible overall return-on-investments are:
1. Absolute Return (if GDX price unchanged at $28.48 at Jul2013 expiration:): +3.9%
= +$336.85/$8,552.95
Annualized Return If Unchanged (ARIU): +38.9%
= (+$336.85/$8,552.95)*(365/37 days); OR
2. Absolute Return if Assigned (at $29.00): +5.8%
= +$492.85/$8,552.95
Annualized Return If Assigned (ARIA): +56.8%
= (+$492.85/$8,552.95)*(365/37 days)
Thursday, June 13, 2013
Established 100% Cash-Secured Puts -- Potash Corp of Saskatchewan Inc.
 Today, the Covered Calls Advisor established a new 100% Cash-Secured Puts position in Potash Corp of Saskatchewan Inc. (Ticker Symbol POT) with a Jul2013 expiration.
The transaction was as follows:
06/13/2013 Sold 3 Potash Corp of Saskatchewan Inc. (POT) Jul2013 $41.00 Put Options @ $1.85
Note: the price of POT was $40.11 today when these Puts were sold. The Covered Calls Advisor does not use margin, so the detailed information on this position and some potential results shown below reflect the fact that this position was established using 100% cash securitization for the three Put options sold.
A possible overall performance results (including commissions) for this POT transaction would be as follows:
100% Cash-Secured Cost Basis: $12,300.00 = $41.00*300
Net Profit:
(a) Options Income: +$543.80
= ($1.85*300 shares) - $11.20 commissions
(b) Dividend Income: +$0.00
(c) Capital Appreciation (If POT unchanged at $40.11 at Jul2013 expiration): -$267.00
= ($40.11-$41.00)*300 shares
(c) Capital Appreciation (If POT above $41.00 at Jul2013 expiration): +$0.00
= ($41.00-$41.00)*300 shares
Total Net Profit (If POT is unchanged at $40.11 at Jul2013 options expiration): +$267.80
= (+$543.80 +$0.00 -$267.00)
Total Net Profit (If POT is above $41.00 strike price at Jul2013 options expiration): +$543.80 = (+$543.80 +$0.00 +$0.00)
1. Absolute Return (If POT unchanged at $40.11 at Jul2013 options expiration and Put options are exercised at $41.00): +2.3%
= +$267.80/$12,300.00
Annualized Return (If stock price unchanged at $40.11 at expiration and Put options thus expire worthless): +21.6%
= (+$267.80/$12,300.00)*(365/38 days); OR
2. Absolute Return (If POT above $41.00 at Jul2013 options expiration and Put options thus expire worthless): +4.4%
= +$543.80/$12,300.00
Annualized Return (If stock price above $41.00 at expiration): +42.5%
= (+$543.80/$12,300.00)*(365/38 days)
Wednesday, June 12, 2013
Established Symantec Corp. Covered Calls -- Example of Early Assignment or Dividend Capture Strategy

06/12/2013 Sold 5 SYMC Jun2013 $22.00 Call Options @ $.40
06/17/2013 Ex-dividend of $.15 per share
This covered calls investment is a strategic one that explicitly considers the upcoming quarterly dividend of $.15 with an ex-dividend date next Monday (June 17th). If the current time value (i.e. extrinsic value) of $.21 = [$.40 option premium - ($22.19 stock price - $22.00 strike price)] remaining in the short call option decays to less than the $.15 ex-divident amount by this Friday [June 14th (the business day prior to the ex-div date)], then there is a reasonably good possibility that the call options owner will exercise early and will call the stock away to capture the dividend. As shown below, two potential returns for this position are:
If Early Assignment: +0.75% absolute return (equivalent to +54.8% annualized return) if the stock is assigned early (day prior to June 17th ex-div date); OR
If Dividend Capture: +1.4% absolute return (equivalent to +47.3% annualized return) if the stock is assigned at June 2013 expiration on June 21st As is often the case, early assignment provides a higher annualized return, so this is the Covered Calls Advisor's preferred outcome; but either outcome would provide a very good return. These returns will be achieved as long as the stock stays above the $22.00 strike price at assignment (0.9% of downside protection). Alternatively, if the stock declines below the strike price, the breakeven price of $21.79 ($22.19-$.40) provides 1.8% downside protection from the original $22.19 purchase price.
In summary, this covered calls investment provides the potential for nice absolute and annualized ROIs for a short-term (less than 2 weeks) covered calls trade. Normally, the Covered Calls Advisor uses this strategy for approximately one-month expirations, but this shorter-term situation was done to show that this strategy can be applied to other timeframes also.
The Covered Calls Advisor has established a set of criteria to identify situations that are advantageous for establishing covered calls positions that might achieve good returns from either an early assignment or from assignment upon options expiration. There are a very limited number of these "Early Assignment or Dividend Capture" covered call opportunites that meet the criteria below, but if/when we find them we should take full advantage.
As shown below, this SYMC position satisfies most of these criteria:

Two possible overall performance results (including commissions) for this Symantec Corp (SYMC) covered calls position are as follows:
Stock Purchase Cost: $11,103.95= ($22.19*500+$8.95 commission)
Net Profit:
(a) Options Income: +$187.30
= ($.40*500 shares) - $12.70 commissions
(b) Dividend Income (If option exercised early on day prior to Jun 17th ex-div date): +$0.00
(b) Dividend Income (If stock assigned at Jun2013 expiration): +$75.00
= ($.15 dividend per share x 500 shares); or
(c) Capital Appreciation (If stock assigned early on June 14th): -$103.95
+($22.00-$22.19)*500 - $8.95 commissions; or
(c) Capital Appreciation (If stock assigned at $22.00 at Jun2013 expiration): -$103.95
+($22.00-$22.19)*500 - $8.95 commissions
+($22.00-$22.19)*500 - $8.95 commissions; or
(c) Capital Appreciation (If stock assigned at $22.00 at Jun2013 expiration): -$103.95
+($22.00-$22.19)*500 - $8.95 commissions
Total Net Profit (If option exercised on day prior to Jun 17th ex-div date): +$83.35
= (+$187.30 +$0.00 -$103.95); or
Total Net Profit (If stock assigned at $22.00 at Jun2013 expiration): +$158.35
= (+$187.30 +$0.00 -$103.95); or
Total Net Profit (If stock assigned at $22.00 at Jun2013 expiration): +$158.35
= (+$187.30 +$75.00 -$103.95)
1. Absolute Return (If option exercised on day prior to Jun 17th ex-div date): +0.75%
= +$83.35/$11,103.95
Annualized Return (If option exercised early): +54.8%
= (+$83.35/$11,103.95)*(365/5 days); OR
2. Absolute Return (If stock assigned at $22.00 at Jun2013 expiration): +1.4%
= +$158.35/$11,103.95
Annualized Return (If stock assigned): +47.3%
= +$83.35/$11,103.95
Annualized Return (If option exercised early): +54.8%
= (+$83.35/$11,103.95)*(365/5 days); OR
2. Absolute Return (If stock assigned at $22.00 at Jun2013 expiration): +1.4%
= +$158.35/$11,103.95
Annualized Return (If stock assigned): +47.3%
= (+$158.35/$11,103.95)*(365/11 days);
Monday, June 10, 2013
Established 100% Cash-Secured Puts -- iShares MSCI Emerging Markets ETF

The transaction was as follows:
06/10/2013 Sold 3 iShares MSCI Emerging Markets ETF (EEM) Jul2013 $39.00 Put Options @ $.82
Note: the price of EEM was $40.20 today when these Puts were sold.
06/10/2013 Sold 3 iShares MSCI Emerging Markets ETF (EEM) Jul2013 $39.00 Put Options @ $.82
Note: the price of EEM was $40.20 today when these Puts were sold.
The Covered Calls Advisor does not use margin, so the detailed information on this position and some potential results shown below reflect the fact that this position was established using 100% cash securitization for the three Put options sold.
A possible overall performance results(including commissions) for this EEM transaction would be as follows:
100% Cash-Secured Cost Basis: $11,700.00 = $39.00*300
Net Profit:
(a) Options Income: +$234.80
= ($.82*300 shares) - $11.20 commissions
(b) Dividend Income: +$0.00
(c) Capital Appreciation (If EEM remains above $39.00 at Jul2013 expiration): +$0.00
= ($39.00-$39.00)*300 shares
Total Net Profit (If EEM is above $39.00 strike price at Jul2013 options expiration): +$234.80 = (+$234.80 +$0.00 +$0.00)
Absolute Return (If EEM above $39.00 at Jul2013 options expiration and Put options thus expire worthless): +2.0%
= +$234.80/$11,700.00
Annualized Return (If EEM above $39.00 at expiration): +17.9%
= (+$234.80/$11,700.00)*(365/41 days)
Established Dow Chemical Company Covered Calls -- Example of Early Assignment or Dividend Capture Strategy
 Today, a new covered calls position was established in Dow Chemical Company (Ticker Symbol DOW) with a Jul2013 expiration and at the $33.00 strike price. The transactions are as follows:
06/10/2013 Sold 3 DOW Jul2013 $33.00 Call Options @ $1.99
Note: the price of DOW was $34.65 today when these options were sold.
06/26/2013 Ex-dividend of $.32 per share
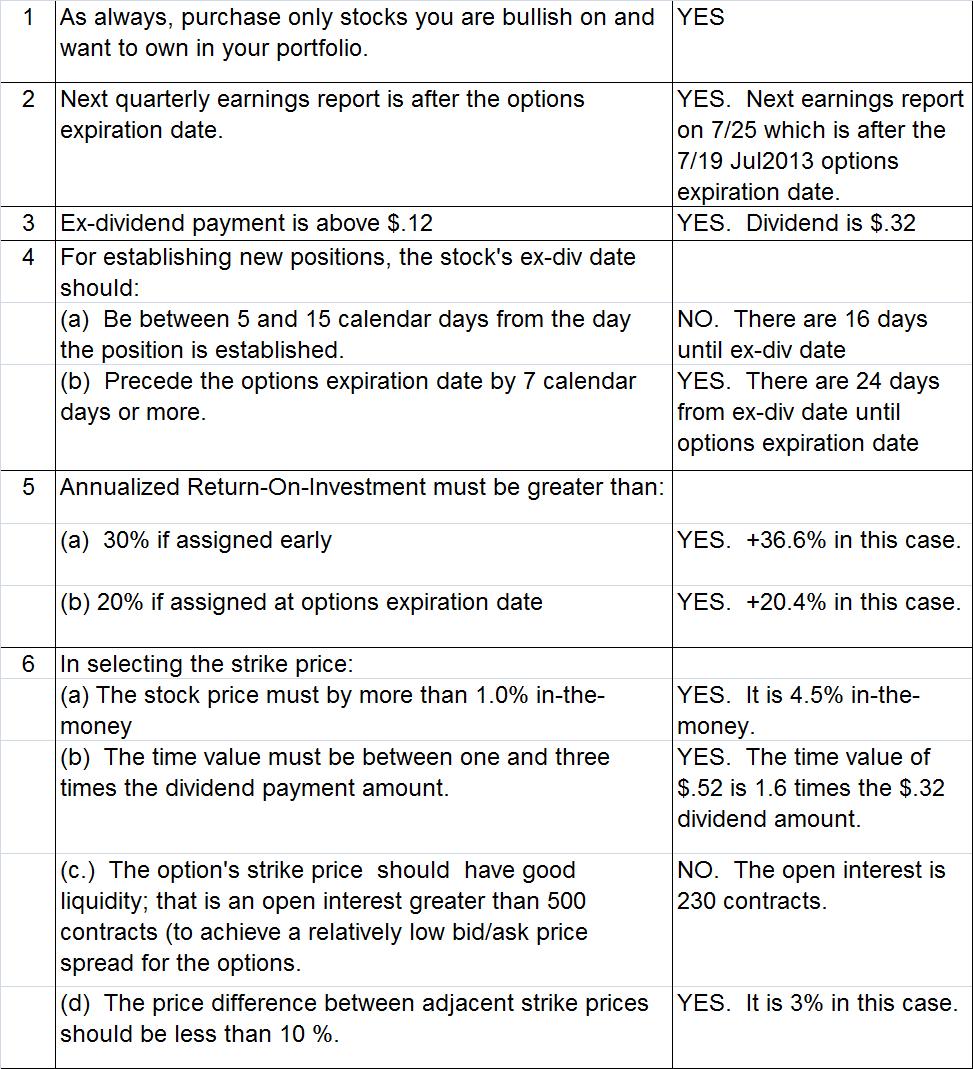
This covered calls investment is a strategic one that explicitly considers the upcoming quarterly dividend of $.32 with an ex-dividend date of June 26th. If the current time value (i.e. extrinsic value) of $.52 [$1.99 option premium - ($34.47 stock price - $$33.00 strike price)] remaining in the short call option decays to less than $.32 by June 25th (the day prior to the ex-div date), then there is a reasonably good possibility that the call options owner will exercise early and will call the stock away to capture the dividend. As shown below, two potential returns for this position are:
If Early Assignment: +36.6% annualized return if the stock is assigned early (day prior to June 26th ex-div date); OR
If Dividend Capture: +20.4% annualized return if the stock is assigned at July 2013 expiration on July 20th As is often the case, early assignment provides a higher annualized return, so this is the Covered Calls Advisor's preferred outcome; but either outcome would provide a very good return. These returns will be achieved as long as the stock stays above the $33.00 strike price at assignment -- a nice 4.3% of downside protection. Alternatively, if the stock declines below the strike price, the breakeven price of $32.48 ($33.47-$1.99) provides a substantial 5.8% downside protection from the original $33.47 purchase price.
In summary, this covered calls investment provides a very nice annualized ROI potential for such a conservative (hedged with substantial downside protection and the next earnings announcement is after the July options expiration date) investment.
The Covered Calls Advisor has established a set of criteria to identify situations that are advantageous for establishing covered calls positions that might achieve good returns from either an early assignment or from assignment upon options expiration. There are a very limited number of these "Early Assignment or Dividend Capture" covered call opportunites that meet the criteria below, but if/when we find them we should take full advantage.
As shown below, this DOW position satisfies almost all these criteria:
Two possible overall performance results (including commissions) for this Dow Chemical Company (DOW) covered calls position are as follows:
Stock Purchase Cost: $10,349.95= ($34.47*300+$8.95 commission)
Net Profit:
(a) Options Income: +$585.80
= ($1.99*300 shares) - $11.20 commissions
(b) Dividend Income (If option exercised early on day prior to Jun 26th ex-div date): +$0.00
(b) Dividend Income (If stock assigned at Jul2013 expiration): +$96.00 = ($.32 dividend per share x 300 shares); or
(c) Capital Appreciation (If stock assigned early on June 25th): -$449.95
+($33.00-$34.47)*300 - $8.95 commissions; or
(c) Capital Appreciation (If stock assigned at $33.00 at Jul2013 expiration): -$449.95 +($33.00-$34.47)*300 - $8.95 commissions
+($33.00-$34.47)*300 - $8.95 commissions; or
(c) Capital Appreciation (If stock assigned at $33.00 at Jul2013 expiration): -$449.95 +($33.00-$34.47)*300 - $8.95 commissions
Total Net Profit (If option exercised on day prior to Jun 26th ex-div date): +$135.85
= (+$585.80 +$0.00 -$449.95); or
Total Net Profit (If stock assigned at $33.00 at Jul2013 expiration): +$231.85
= (+$585.80 +$0.00 -$449.95); or
Total Net Profit (If stock assigned at $33.00 at Jul2013 expiration): +$231.85
= (+$585.80 +$96.00 -$449.95)
1. Absolute Return (If option exercised on day prior to Jun 26th ex-div date): +1.6%
= +$135.85/$10,349.95
Annualized Return (If option exercised early): +36.6%
= (+$135.85/$10,349.95)*(365/16 days); OR
2. Absolute Return (If stock assigned at $33.00 at Jul2013 expiration): +2.2% = +$231.85/$10,349.95 Annualized Return (If stock assigned): +20.4%
= +$135.85/$10,349.95
Annualized Return (If option exercised early): +36.6%
= (+$135.85/$10,349.95)*(365/16 days); OR
2. Absolute Return (If stock assigned at $33.00 at Jul2013 expiration): +2.2% = +$231.85/$10,349.95 Annualized Return (If stock assigned): +20.4%
= (+$231.85/$10,349.95)*(365/40 days);
Saturday, June 8, 2013
Overall Market Meter Rating Remains at "Neutral"
The Covered Calls Advisor recalculated the current values for each of the eight factors used to determine the "Overall Market Meter" rating. This month, the Overall Market Meter rating remains unchanged at Neutral.
The eight factors used can be categorized as:
- macroeconomic (the first two indicators in the chart below),
- momentum (next two indicators in the chart),
- value (next three indicators), and
- growth (the last indicator).

The current Market Meter Average of 3.25 (see blue line at the bottom of the chart above) is slightly lower than the 3.50 average when the rating was last calculated in February, but remains as Neutral overall (Neutral range is from 2.51 to 3.50).
As shown in the right sidebar, the covered calls investing strategy corresponding to this overall Slightly Bullish sentiment is to "on-average sell 1% out-of-the-money covered calls for the nearest expiration month."
Your comments or questions regarding this post (or the details related to any of the eight factors used in this model) are welcomed. Please email me at the address shown in the upper-right sidebar.
Regards and Godspeed,
Jeff
Friday, June 7, 2013
Establish Covered Calls -- Barrick Gold Corp.
Today, a new covered calls position was established in Barrick Gold Corp. (Ticker Symbol ABX) with a Jun2013 options expiration date. The details are as follows:
06/07/2013 Sold 3 ABX Jun2013 $20.00 Call Options @ $.99
Note: the price of ABX was $20.45 when the options were sold.
A possible overall performance result (including commissions) for these Barrick Gold (ABX) covered calls is as follows:
Stock Purchase Cost: $6,134.35
= ($20.418*300+$8.95 commission)
Net Profit:
(a) Options Income: +$285.80
= 300*$.99 - $11.20 commissions
(b) Dividend Income: +$0.00
(c) Capital Appreciation (If ABX assigned at $20.00) = -$134.35
= ($20.00-$20.418)*300 - $8.95 commissions
Total Net Profit (If ABX assigned at $20.00): +$151.45
= (+$285.80 +$0.00 -$134.35)
Absolute Return if Assigned (at $20.00): +2.5%
= +$151.45/$6,134.35
Annualized Return If Assigned (ARIA): +56.3%
= (+$151.45/$6,134.35)*(365/16 days)
1. Barrick Gold Corp. (ABX) -- New Covered Calls Position
The transactions were as follows:
06/07/2013 Bought 300 ABX shares @ $20.418 06/07/2013 Sold 3 ABX Jun2013 $20.00 Call Options @ $.99
Note: the price of ABX was $20.45 when the options were sold.
A possible overall performance result (including commissions) for these Barrick Gold (ABX) covered calls is as follows:
Stock Purchase Cost: $6,134.35
= ($20.418*300+$8.95 commission)
Net Profit:
(a) Options Income: +$285.80
= 300*$.99 - $11.20 commissions
(b) Dividend Income: +$0.00
(c) Capital Appreciation (If ABX assigned at $20.00) = -$134.35
= ($20.00-$20.418)*300 - $8.95 commissions
Total Net Profit (If ABX assigned at $20.00): +$151.45
= (+$285.80 +$0.00 -$134.35)
Absolute Return if Assigned (at $20.00): +2.5%
= +$151.45/$6,134.35
Annualized Return If Assigned (ARIA): +56.3%
= (+$151.45/$6,134.35)*(365/16 days)
Thursday, June 6, 2013
Established 100% Cash-Secured Puts -- iShares MSCI Emerging Markets ETF
 Today, the Covered Calls Advisor established a new 100% Cash-Secured Puts position in iShares MSCI Emerging Markets ETF (Ticker Symbol EEM) with a Jul2013 expiration and at the $39.00 strike price. As detailed below, this investment will provide a +2.0% absolute return in 41 days (which is equivalent to a +17.9% annualized return) if EEM closes at or above the $39.00 strike price at options expiration on July 19th.
The transaction was as follows:
06/10/2013 Sold 3 iShares MSCI Emerging Markets ETF (EEM) Jul2013 $39.00 Put Options @ $.82
Note: the price of EEM was $40.20 today when these Puts were sold.
06/10/2013 Sold 3 iShares MSCI Emerging Markets ETF (EEM) Jul2013 $39.00 Put Options @ $.82
Note: the price of EEM was $40.20 today when these Puts were sold.
The Covered Calls Advisor does not use margin, so the detailed information on this position and some potential results shown below reflect the fact that this position was established using 100% cash securitization for the three Put options sold.
A possible overall performance results(including commissions) for this EEM transaction would be as follows:
100% Cash-Secured Cost Basis: $11,700.00 = $39.00*300
Net Profit:
(a) Options Income: +$234.80
= ($.82*300 shares) - $11.20 commissions
(b) Dividend Income: +$0.00
(c) Capital Appreciation (If EEM remains above $39.00 at Jul2013 expiration): +$0.00
= ($39.00-$39.00)*300 shares
Total Net Profit (If EEM is above $39.00 strike price at Jul2013 options expiration): +$234.80 = (+$234.80 +$0.00 +$0.00)
Absolute Return (If EEM above $39.00 at Jul2013 options expiration and Put options thus expire worthless): +2.0%
= +$234.80/$11,700.00
Annualized Return (If stock price above $39.00 at expiration): +17.9%
= (+$234.80/$11,700.00)*(365/41 days)
Wednesday, June 5, 2013
Established 100% Cash-Secured Puts -- Fusion-io Inc., Hertz Global Holdings Inc., JC Penney Co. Inc., and Transocean Inc.
Yesterday, the Covered Calls Advisor established four 100% Cash-Secured Puts positions in Fusion-io Inc. (Ticker Symbol FIO), Hertz Global Holdings Inc. (HTZ), JC Penney Co. Inc. (JCP), and Transocean Inc. (RIG). Fusion-io and Transocean were sold with June 2013 option expirations and JC Penney and Hertz were sold with the July 2013 options expiration month.
The Covered Calls Advisor does not use margin, so the detailed information on these positions and some potential results shown below reflect the fact that these positions were established using 100% cash securitization for the Put options sold.
As shown below, the absolute return-on-investment (ROI) percent and the comparable annualized ROI (if stock price is unchanged at options expiration date) are as follows:
- Fusion-io = +3.7% Absolute; +70.3% Annualized
- Hertz = +3.3% Absolute; +25.2% Annualized
- JC Penney = +6.1%; +47.6% Annualized
- Transocean = +1.4%; +27.6% Annualized
The transactions made and some possible results are detailed below.
1. Fusion-io Inc.

The transaction was as follows:
06/04/2013 Sold 3 Fusion-io Inc. (FIO) Jun2013 $14.00 Put Options @ $.55
Note: the price of FIO was $14.29 when these Puts were sold.
A possible overall performance results(including commissions) for this FIO transaction would be as follows:
100% Cash-Secured Cost Basis: $4,200.00
= $14.00*300
Net Profit:
(a) Options Income: +$153.80
= ($.55*300 shares) - $11.20 commissions
(b) Dividend Income: +$0.00
(c) Capital Appreciation (If FIO remains above $14.00 at Jun2013 expiration): +$0.00
= ($14.00-$14.00)*300 shares
Total Net Profit (If FIO is above $14.00 strike price at Jun2013 options expiration): +$153.80 = (+$153.80 +$0.00 +$0.00)
Absolute Return (If FIO above $14.00 at Jun2013 options expiration and Put options thus expire worthless): +3.7%
= +$153.80/$4,200.00
Annualized Return (If stock price above $14.00 at expiration): +70.3%
= (+$153.80/$4,200.00)*(365/19 days)
2. Hertz Global Holdings Inc.

The transaction was as follows:
06/04/2013 Sold 3 Hertz (HTZ) Jul2013 $25.00 Put Options @ $.85
Note: the price of HTZ was $25.76 when these Puts were sold.
= $25.00*300
Net Profit:
(a) Options Income: +$243.80
= ($.85*300 shares) - $11.20 commissions
(b) Dividend Income: +$0.00
(c) Capital Appreciation (If HTZ remains above $25.00 at Jul2013 expiration): +$0.00
= ($25.00-$25.00)*300 shares
Total Net Profit (If HTZ is above $25.00 strike price at Jul2013 options expiration): +$243.80
= (+$243.80 +$0.00 +$0.00)
Absolute Return (If HTZ above $25.00 at Jul2013 options expiration and Put options thus expire worthless): +3.3%
= +$243.80/$7,500.00
Annualized Return (If stock price above $25.00 at expiration): +25.2%
= (+$243.80/$7,500.00)*(365/47 days)
3. JC Penney Co. Inc.
The transaction was as follows:

06/04/2013 Sold 3 JC Penney Co. Inc. (JCP) Jul2013 $18.00.00 Put Options @ $1.34
Note: the price of JCP was $17.80 when these Puts were sold.
A possible overall performance results(including commissions) for this JCP transaction would be as follows:
100% Cash-Secured Cost Basis: $5,400.00
= $18.00*300
Net Profit:
(a) Options Income: +$390.80
= ($1.34*300 shares) - $11.20 commissions
(b) Dividend Income: +$0.00
(c) Capital Appreciation (If JCP price remains unchanged at $17.80 at Jul2013 expiration):
-$60.00 = ($17.80-$25.00)*300 shares; OR
(c) Capital Appreciation (If JCP is above $18.00 strike price at Jul2013 expiration): +$0.00
= ($18.00-$18.00)*300 shares
Total Net Profit (If JCP price remains unchanged at $17.80 at Jul2013 options expiration): +$330.80 = (+$390.80 +$0.00 -$60.00); OR
Total Net Profit (If JCP is above $18.00 strike price at Jul2013 options expiration): +$390.80
= (+$390.80 +$0.00 +$0.00)
1. Absolute Return (If JCP price remains unchanged at $17.80 at Jul2013 options expiration): +6.1%
= +$330.80/$5,400.00
Annualized Return (If stock price unchanged at $17.80 at expiration): +47.6%
= (+$330.80/$5,400.00)*(365/47 days)
2. Absolute Return (If JCP above $18.00 at Jul2013 options expiration and Put options thus expire worthless): +7.2%
= +$390.80/$5,400.00
Annualized Return (If stock price above $18.00 at expiration): +56.2%
= (+$390.80/$5,400.00)*(365/47 days)
4. Transocean Inc.
The transaction was as follows:

06/04/2013 Sold 2 Transocean Inc. (RIG) Jun2013 $50.00 Put Options @ $.77
Note: the price of RIG was $51.08 when these Puts were sold.

The transaction was as follows:
06/04/2013 Sold 3 Hertz (HTZ) Jul2013 $25.00 Put Options @ $.85
Note: the price of HTZ was $25.76 when these Puts were sold.
A possible overall performance results(including commissions) for this HTZ transaction would be as follows:
100% Cash-Secured Cost Basis: $7,500.00 = $25.00*300
Net Profit:
(a) Options Income: +$243.80
= ($.85*300 shares) - $11.20 commissions
(b) Dividend Income: +$0.00
(c) Capital Appreciation (If HTZ remains above $25.00 at Jul2013 expiration): +$0.00
= ($25.00-$25.00)*300 shares
Total Net Profit (If HTZ is above $25.00 strike price at Jul2013 options expiration): +$243.80
= (+$243.80 +$0.00 +$0.00)
Absolute Return (If HTZ above $25.00 at Jul2013 options expiration and Put options thus expire worthless): +3.3%
= +$243.80/$7,500.00
Annualized Return (If stock price above $25.00 at expiration): +25.2%
= (+$243.80/$7,500.00)*(365/47 days)
3. JC Penney Co. Inc.
The transaction was as follows:

06/04/2013 Sold 3 JC Penney Co. Inc. (JCP) Jul2013 $18.00.00 Put Options @ $1.34
Note: the price of JCP was $17.80 when these Puts were sold.
A possible overall performance results(including commissions) for this JCP transaction would be as follows:
100% Cash-Secured Cost Basis: $5,400.00
= $18.00*300
Net Profit:
(a) Options Income: +$390.80
= ($1.34*300 shares) - $11.20 commissions
(b) Dividend Income: +$0.00
(c) Capital Appreciation (If JCP price remains unchanged at $17.80 at Jul2013 expiration):
-$60.00 = ($17.80-$25.00)*300 shares; OR
(c) Capital Appreciation (If JCP is above $18.00 strike price at Jul2013 expiration): +$0.00
= ($18.00-$18.00)*300 shares
Total Net Profit (If JCP price remains unchanged at $17.80 at Jul2013 options expiration): +$330.80 = (+$390.80 +$0.00 -$60.00); OR
Total Net Profit (If JCP is above $18.00 strike price at Jul2013 options expiration): +$390.80
= (+$390.80 +$0.00 +$0.00)
1. Absolute Return (If JCP price remains unchanged at $17.80 at Jul2013 options expiration): +6.1%
= +$330.80/$5,400.00
Annualized Return (If stock price unchanged at $17.80 at expiration): +47.6%
= (+$330.80/$5,400.00)*(365/47 days)
2. Absolute Return (If JCP above $18.00 at Jul2013 options expiration and Put options thus expire worthless): +7.2%
= +$390.80/$5,400.00
Annualized Return (If stock price above $18.00 at expiration): +56.2%
= (+$390.80/$5,400.00)*(365/47 days)
4. Transocean Inc.
The transaction was as follows:
06/04/2013 Sold 2 Transocean Inc. (RIG) Jun2013 $50.00 Put Options @ $.77
Note: the price of RIG was $51.08 when these Puts were sold.
A possible overall performance results(including commissions) for this RIG transaction would be as follows:
100% Cash-Secured Cost Basis: $10,000.00
= $50.00*200
Net Profit:
(a) Options Income: +$143.55
= ($.77*200 shares) - $10.45 commissions
(b) Dividend Income: +$0.00
(c) Capital Appreciation (If RIG remains above $50.00 at Jun2013 expiration): +$0.00
= ($50.00-$50.00)*200 shares
Total Net Profit (If RIG is above $50.00 strike price at Jun2013 options expiration): +$143.55
= (+$143.55 +$0.00 +$0.00)
Absolute Return (If RIG above $50.00 at Jun2013 options expiration and Put options thus expire worthless): +1.4%
= +$143.55/$10,000.00
Annualized Return (If stock price above $50.00 at expiration): +27.6%
= (+$143.55/$10,000.00)*(365/19 days)
Monday, June 3, 2013
Establish Covered Calls -- iShares MSCI China ETF
Today, a new covered calls position was established in iShares MSCI China ETF (Ticker Symbol FXI) with a Jun2013 options expiration date. The details are as follows:
1. iShares MSCI China ETF (FXI) -- New Covered Calls Position
 The transactions were as follows:
06/03/2013 Bought 700 FXI shares @ $36.25
06/03/2013 Sold 7 FXI Jun2013 $36.00 Call Options @ $.90
Note: the price of FXI was $36.27 when the options were sold.
A possible overall performance result (including commissions) for these iShares MSCI China ETF (FXI)covered calls is as follows:
Stock Purchase Cost: $25,383.95
= ($36.25*700+$8.95 commission)
Net Profit:
(a) Options Income: +$615.80
= 700*$.90 - $14.20 ommissions
(b) Dividend Income: +$0.00
(c) Capital Appreciation (If FXI assigned at $36.00) = -$183.95
= ($36.00-$36.25)*700 - $8.95 commissions
Total Net Profit (If FXI assigned at $36.00): +$431.85
= (+$615.80 +$0.00 -$183.95)
Absolute Return if Assigned (at $36.00): +1.7%
= +$431.85/$25,383.95
Annualized Return If Assigned (ARIA): +31.0%
= (+$431.85/$25,383.95)*(365/20 days)
1. iShares MSCI China ETF (FXI) -- New Covered Calls Position

06/03/2013 Bought 700 FXI shares @ $36.25
06/03/2013 Sold 7 FXI Jun2013 $36.00 Call Options @ $.90
Note: the price of FXI was $36.27 when the options were sold.
A possible overall performance result (including commissions) for these iShares MSCI China ETF (FXI)covered calls is as follows:
Stock Purchase Cost: $25,383.95
= ($36.25*700+$8.95 commission)
Net Profit:
(a) Options Income: +$615.80
= 700*$.90 - $14.20 ommissions
(b) Dividend Income: +$0.00
(c) Capital Appreciation (If FXI assigned at $36.00) = -$183.95
= ($36.00-$36.25)*700 - $8.95 commissions
Total Net Profit (If FXI assigned at $36.00): +$431.85
= (+$615.80 +$0.00 -$183.95)
Absolute Return if Assigned (at $36.00): +1.7%
= +$431.85/$25,383.95
Annualized Return If Assigned (ARIA): +31.0%
= (+$431.85/$25,383.95)*(365/20 days)
Establish Covered Calls -- Fluor Corporation
Today, a new covered calls position was established in Fluor Corporation (Ticker Symbol FLR) with a Jun2013 options expiration date. The details are as follows:
 1. Fluor Corporation (FLR) -- New Covered Calls Position
06/03/2013 Sold 2 FLR Jun2013 $62.50 Call Options @ $1.80.
Note: the price of FLR was $62.69 when the options were sold.
A possible overall performance result (including commissions) for these Fluor Corporation (FLR) covered calls is as follows:
Stock Purchase Cost: $12,540.95
= ($62.66*200+$8.95 commission)
Net Profit:
(a) Options Income: +$349.55
= 200*$1.80 - $10.45 ommissions
(b) Dividend Income: +$0.00
(c) Capital Appreciation (If FLR assigned at $62.50) = -$40.95
= ($62.50-$62.66)*200 - $8.95 commissions
Total Net Profit (If FLR assigned at $62.50): +$308.60
= (+$349.55 +$0.00 -$40.95)
Absolute Return if Assigned (at $62.50): +2.5%
= +$308.60/$12,540.95
Annualized Return If Assigned (ARIA): +44.9%
= (+$308.60/$12,540.95)*(365/20 days)
 1. Fluor Corporation (FLR) -- New Covered Calls Position
The transactions were as follows:
06/03/2013 Bought 200 FLR shares @ $62.66 06/03/2013 Sold 2 FLR Jun2013 $62.50 Call Options @ $1.80.
Note: the price of FLR was $62.69 when the options were sold.
A possible overall performance result (including commissions) for these Fluor Corporation (FLR) covered calls is as follows:
Stock Purchase Cost: $12,540.95
= ($62.66*200+$8.95 commission)
Net Profit:
(a) Options Income: +$349.55
= 200*$1.80 - $10.45 ommissions
(b) Dividend Income: +$0.00
(c) Capital Appreciation (If FLR assigned at $62.50) = -$40.95
= ($62.50-$62.66)*200 - $8.95 commissions
Total Net Profit (If FLR assigned at $62.50): +$308.60
= (+$349.55 +$0.00 -$40.95)
Absolute Return if Assigned (at $62.50): +2.5%
= +$308.60/$12,540.95
Annualized Return If Assigned (ARIA): +44.9%
= (+$308.60/$12,540.95)*(365/20 days)
Subscribe to:
Posts (Atom)